
Distribution of Personal Income
These statistics take one of BEA's primary economic indicators—U.S. personal income—and measure how it is distributed across households. This provides a way to assess how households share in the nation's economic growth. The statistics build on more than a decade of BEA research by bringing in new sources of data, including demographic surveys, aggregated tax records, and administrative records.
The first prototype statistics were published in March 2020. Since then, BEA has continued publishing new data and making improvements:
- Distribution of disposable personal income added in 2020.
- Supplemental internationally comparable data added in 2022.
- State distribution of personal income added in October 2023.
- Interactive data tables for the national statistics added in December 2023.
- Distribution of personal saving added in July 2024.

Distribution of U.S. Personal Income
The December 2024 distribution of personal income release revises all previous years and provides provisional data for 2023. Estimates for 2022 are available as a separate file, consistent with previous releases. Estimates for 2000-2023 are available in a pooled summary file. Given the importance of providing timely data, extrapolations were made for several income sources with unavailable data to provide distributional estimates for 2023 (provisional summary file). Because the top 1 percent and top 5 percent income shares are substantially influenced by not-yet-available Statistics of Income source data for 2023, interval ranges are provided for these estimates.
Distribution of State Personal Income
Prototype statistics showing how personal income is distributed across households in each state and the District of Columbia were updated in June 2024. The release added new statistics for 2022 and updated 2021 statistics with new source data. These statistics build on the methodology BEA uses to estimate the national distribution of personal income. They are consistent with and complement existing BEA data on state personal income totals. Data users are invited to provide feedback on these prototype state statistics as we continue to research and make improvements.
Note. The Gini is a measure of inequality on a scale of 0-1, where 1 represents complete inequality and 0 represents complete equality.
Internationally Comparable Statistics
An updated series of internationally comparable inequality research statistics has been provided for the same years (2000-2022 + provisional 2023) that follow the guidance of the Organization for Economic Cooperation and Development (OECD) Expert Group on Disparities in a National Accounts framework (EG DNA). Following the same structure as the BEA distribution of personal income tables, this release includes separate file estimates for 2022 and 2023, and summary table for 2000-2023. These tables (and accompanying methodology document) are provided in the "Internationally Comparable Statistics" section on this page.
Distribution of Personal Saving (Based on Joint Distribution of Disposable Personal Income and Personal Consumption Expenditures)
To provide a fuller picture of the well-being of households, BEA and the Bureau of Labor Statistics (BLS) have collaborated to produce a distribution of personal saving, by developing a joint distribution of disposable personal income (DPI) and personal consumption expenditures (PCE). This project is based on the independent DPI and PCE distributions constructed by BEA and BLS, respectively. This is an ongoing research project, with the joint distribution estimates and methodology available in the "Distribution of Personal Saving" section on this page, and the latest independent PCE results on the Distribution of Personal Consumption Expenditures BLS page.
Last updated July 2024; does not reflect the revised distributional estimates released Dec. 10, 2024.
- Includes distribution of personal income by decile, quintile, top 1 percent, and top 5 percent, 2000–2023.
- Download the full dataset of all available years and metrics CSV
- Data for 2022 XLSX
- Provisional Data for 2023 XLSX
- Interactive Tables: Table 2.10. Distributions of Personal and Disposable Income for Households
- Technical Document: An Updated Methodology for Distributing Personal Income PDF December 10, 2024
This document details BEA's methodology for the prototype estimates. - Read-me for Summary File PDF
- Summary of Methodological Updates PDF December 10, 2024
- Measuring Inequality in the National Accounts December 15, 2020
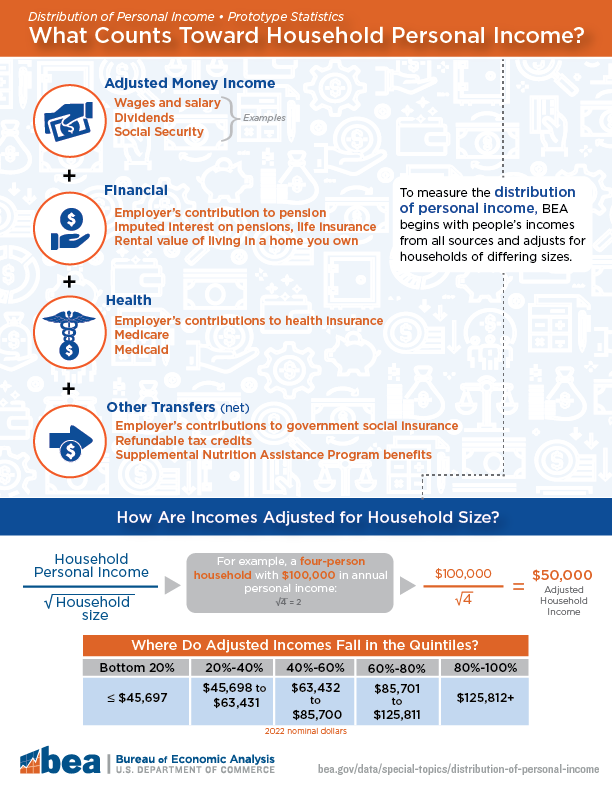
This paper provides context around the prototype estimates released in December 2020, including discussions of measurement issues and the concept of income. - Infographic: Measuring the Distribution of Personal Income PDF and Image PNG
- Includes distribution of state personal income by quintile and top/bottom 10%, 2012–2022.
- Download a summary file of state inequality metrics for 2012-2022 XLSX
- Download detailed files for all states ZIP (Compressed XLSX)
- State Rankings XLSX State rankings for mean and median personal income, before and after adjusting for inflation and regional price differences.
- Technical Document PDF October 24, 2023
This document details BEA's methodology for the prototype estimates. - Developing Statistics on the Distribution of State Personal Income: Methodology and Preliminary Results PDF By Dirk van Duym and Christian Awuku-Budu | U.S. Bureau of Economic Analysis, May 2022
- Archive
- This dataset follows the guidance of the Organization for Economic Cooperation and Development (OECD) Expert Group on Disparities in a National Accounts framework.
- Download the full OECD dataset of all available years and metrics CSV
- Data for 2022 XLSX
- Provisional Data for 2023 XLSX
- OECD Technical Document: An Internationally Comparable Methodology PDF January 16, 2025
- Read-me for OECD Summary File PDF January 16, 2025
- Includes statistics for the distribution of personal saving and joint distribution of disposable personal income and personal consumption expenditures.
Last updated July 2024; does not reflect the revised distributional estimates released Dec. 10, 2024. - Download the full dataset of all available years and metrics XLSX
- Technical Document: The Methodology for Distributing Personal Saving via a Joint Distribution of Disposable Personal Income and Personal Consumption Expenditures PDF
- Read-me for Summary File PDF
- New Statistics Show Distribution of Personal Income Within States October 24, 2023
- New Statistics Measure How Personal Income Is Distributed March 6, 2020
- How households share in an economy's growthBy Dennis J. Fixler | Economic Statistics Centre of Excellence, August 2019
- Do transfers lower inequality between households? Demographic evidence from Distributional National Accounts By Marina Gindelsky | Economic Inquiry. Volume 60, Issue 3. July 2022. Pages 1233-1257
- Developing Statistics on the Distribution of State Personal Income: Methodology and Preliminary Results By Dirk van Duym and Christian Awuku-Budu | U.S. Bureau of Economic Analysis, May 2022
- The Feasibility of a Quarterly Distribution of Personal Income By Dennis Fixler, Marina Gindelsky, and Robert Kornfeld | U.S. Bureau of Economic Analysis, December 2021
- Distributing Personal Income: Trends Over Time By Dennis Fixler, Marina Gindelsky, and David Johnson | National Bureau of Economic Research, March 2020
- Improving the Measure of the Distribution of Personal IncomeBy Dennis J. Fixler, Marina Gindelsky, and David S. Johnson | BEA Paper, February 2019. Published in AEA Papers and Proceedings, May 2019.
- Towards a Distribution of Household Income: Linking Survey Data to Administrative Data PDFby Dennis J. Fixler, Marina Gindelsky, and David S. Johnson | 35th IARIW General Conference, August 2018
- A Consistent Data Series to Evaluate Growth and Inequality in the National Accountsby Dennis J. Fixler, David S. Johnson, Andrew Craig, and Kevin Furlong | Review of Income and Wealth, November 2017
- Toward National and Regional Distributions of Personal Income PDFby Dennis J. Fixler, David S. Johnson, Andrew Craig, and Kevin J. Furlong | SCB, March 2017
- Accounting for the Distribution of Income in the U.S. National Accountsby Dennis J. Fixler and David S. Johnson | Measuring Economic Sustainability and Progress, 2014
What is Distribution of Personal Income?
Measures how households are sharing in the U.S. economy's growth. Shows how total personal income in the United States is distributed across households.
Contact Personnel
-
TechnicalMarina Gindelsky
-
State DataDirk van Duym
-
News MediaConnie O'Connell
-
CongressionalThomas Dail